Kevin Brine

Disconnected: Understanding Household Energy Shutoffs in the Northwest

Energy insecurity—the inability to adequately meet household energy needs—is a widespread issue across the United States. Certain households—including low-income, Black, Hispanic, and Native American households—are disproportionately affected and spend a larger portion of their income on energy bills. Households unable to pay their energy bill risk service disconnection and may be forced to make difficult decisions between paying utility bills and purchasing necessities such as food or medication. In fact, a September 2026 Consumer Reports survey found that one in five Americans report cutting back on groceries to afford electricity bills and approximately one quarter have adjusted their thermostat to uncomfortable levels to lower energy costs.

Data is critical to understanding the factors that contribute to energy insecurity and helping to identify potential solutions. Service disconnection, also known as a shutoff, that results from unpaid bills is one such important data element to understand, but it has historically been hard to obtain this data unless working for a utility. However, earlier this year, the U.S. Energy Information Administration (EIA) released results from the first comprehensive national survey of electricity and natural gas shutoffs, providing public access to a new national dataset.

This blog gives an overview of the EIA dataset, describes customer protections and bill assistance programs in the Northwest, and introduces the new Northwest Clean Energy Atlas visualization that CETI has published with the EIA data.

New EIA Report Provides Disconnection Data

In April 2026, the EIA released the Residential Utility Disconnections Report, the first comprehensive national survey of shutoffs.

The EIA collected data from electric and natural gas utilities on monthly final notices, disconnections, and reconnections due to bill nonpayment (arrearages) for calendar year 2024. For this report, the EIA defines these terms as follows:

  • Final notices: Last notice sent via mail, email, phone, and/or text to residential customers at least one day before account disconnections. Note that one customer account may receive a final notice multiple times in a year. The EIA reports total final notices per month per utility. Unfortunately, it does not specify how many individual accounts received final notices or how many final notices each account received.
  • Disconnections: The involuntary shut-off of electricity and/or natural gas service to residential customers due to bill nonpayment. Note that this category excludes voluntary disconnections (e.g., customers closing an account because they are selling the home, disconnecting from natural gas after electrifying all home appliances, etc.). One account can have multiple disconnections per year, and the EIA did not specify how many individual accounts experienced shutoffs. The EIA also did not collect information about how long each disconnection lasted.
  • Reconnections: Restoring electricity and/or natural gas service to residential customers who previously had service involuntarily disconnected due to bill nonpayment. Like final notices and disconnections, a customer can have multiple reconnections in one year.  

The EIA collected data through a mandatory survey to utilities that deliver electricity or natural gas to residential customers nationwide, representing 100% of natural gas residential customers and 98% of electricity residential customers (small electric utilities were not surveyed).

Nationally, there were approximately 1.7 million residential natural gas disconnections and 13.4 million residential electricity disconnections in 2024.

Customer Protections

Many states, municipalities, and individual utilities have policies in place to protect customers from disconnections in certain weather or in other situations to protect the health of customers. State-level customer protections generally apply only to regulated utilities (i.e., investor-owned utilities) in each state, though individual municipal utilities and electric cooperatives often have their own customer protection policies as well.

In the Northwest, the majority of homes are heated with electricity (51%) or natural gas (38%), and the four Northwest states have various protection policies for customers of regulated electricity and natural gas utilities. Table 1 summarizes state-level policies for regulated electricity utilities, as reported by Indiana University Energy Justice Lab’s Utility Disconnections Dashboard. Some of these policies apply to regulated natural gas utilities too; all four Northwest states have cold-based protections for natural gas customers.
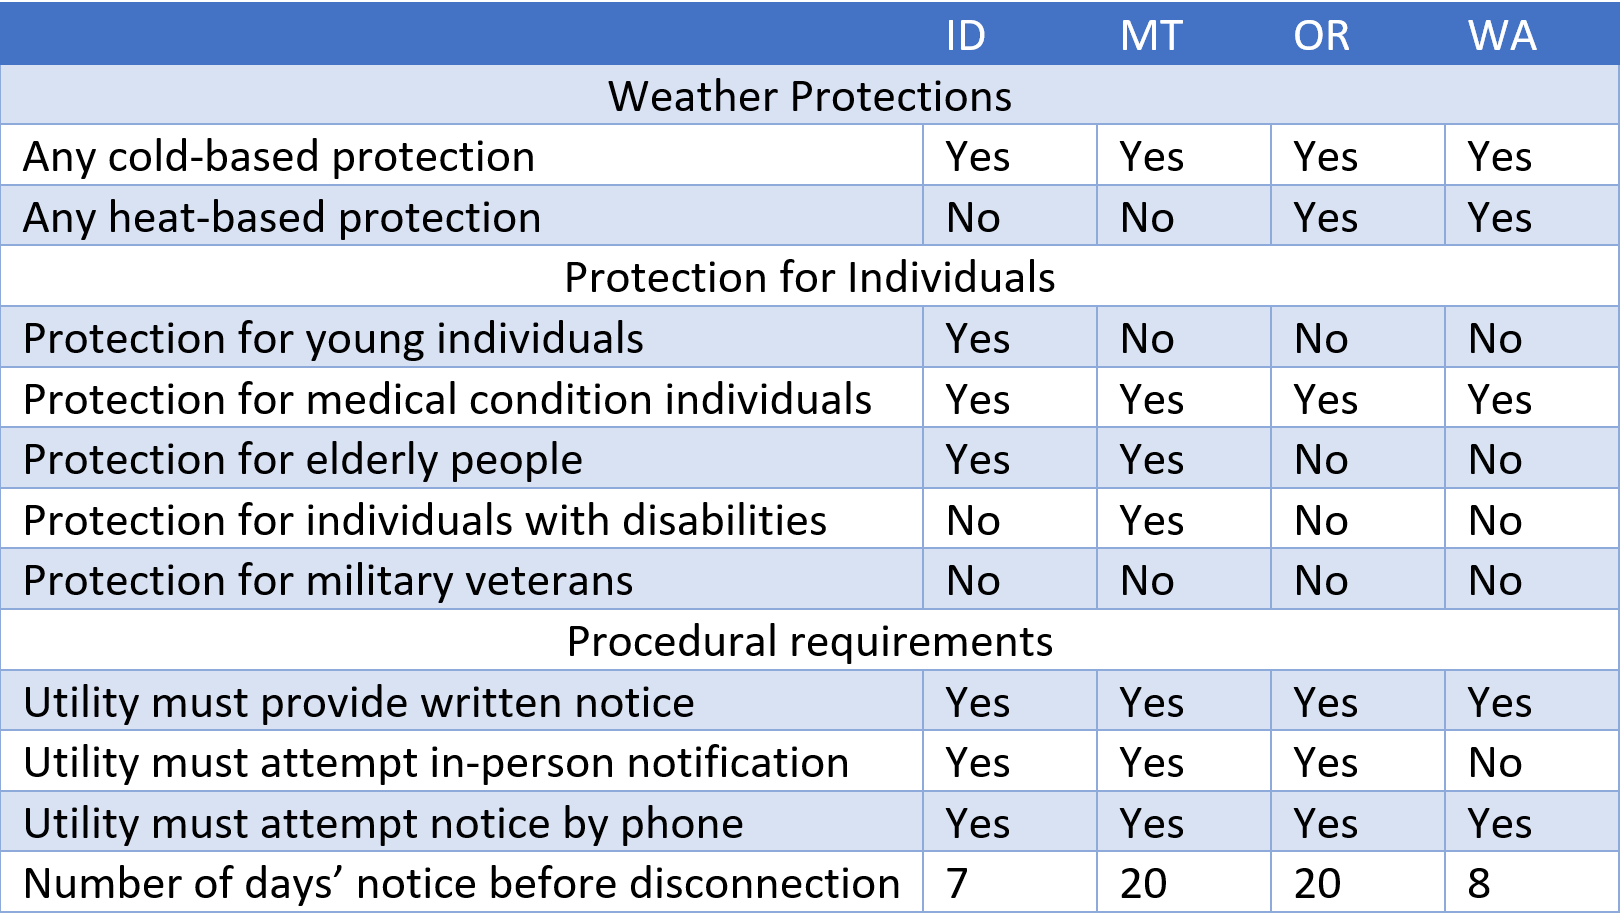
Table 1: State-level Protection Policies for Customers of Regulated Electricity Utilities in the Northwest.

Source: Sanya Carley and David Konisky, 2023, "Utility Disconnections Dashboard," Energy Justice Lab. https://utilitydisconnections.org/dashboard/index.html

‍

For example, regulated electric utilities in Montana are not allowed to disconnect service for nonpayment from November 1 to April 1 if the customer is unable to pay, if the household has someone at least 62 years old, or if the household includes a handicapped individual (with documentation required for all). This cold-based protection holds true throughout the year for households meeting one of those criteria if the temperature at 8am is at or below freezing, or if there is a snowstorm or freezing temperatures forecasted within the next 24 hours. Oregon has an example of a medical protection: if a member of the household has a medical condition (medical certificate required) and the person’s health would be significantly endangered by a disconnection, regulated utilities must delay disconnection for the expected duration of the medical problem (but no more than six months, or 12 months for chronic illnesses; customers can renew the medical certificate).  

There are also different procedural requirements in terms of how the utility is required to provide final notices before disconnection. For more detailed information on the policies in each state, individual state factsheets are available on the Disconnections Dashboard.

However, it is not always enough to have these policies in place. The Energy Justice Lab points out in its 2023 paper, Electric Utility Disconnections: Legal Protections & Policy Recommendations, that many policies are vague, difficult to understand, or include requirements that customers are not aware of. The authors offer four broad recommendations for disconnection policies to be:

  • Easy to understand (e.g., easy-to-follow language, minimize ambiguity in interpretation)
  • Widely accessible (e.g., provide information on protections directly to customers at least twice a year)
  • Designed to reduce administrative burdens for households (e.g., adopt broad definitions of medical conditions, minimizing the burden on the customer to prove they do have a valid medical condition)  
  • Broadened to address impacts of climate change (e.g., use a combination of both date-based and temperature-based protections for better coverage due to more erratic weather patterns)

Some advocates go beyond calling for improvements to disconnection policies and argue that utility disconnections for bill nonpayment should never happen. For example, in Tsunami of Shutoffs, the Energy Equity Project argues that energy service is a human right that should not depend on a household’s ability to pay.

Bill Assistance

Programs exist at the federal, state, and utility level to provide assistance with bill payment. The federal grant program, Low-Income Home Energy Assistance Program (LIHEAP), provides grants to U.S. states and territories to administer for eligible recipients of certain poverty levels (either as a percentage of federal poverty guidelines or the state’s median income). Some states supplement federal LIHEAP funding with additional state energy assistance programs, but the availability of this assistance varies widely. Utilities also run affordability programs, including bill discounts, payment plans, payment assistance grants, and other forms of support.

Visualizing the Disconnection Data

To provide a Northwest-focused look at disconnections, we took the EIA data and created a new visualization for the Northwest Clean Energy Atlas.

The first tab shows residential utility disconnections, final notices, or reconnections, depending on the metric selected. For example, Figure 1 shows the number of electric utility disconnections in Northwest households. Disconnections are typically lower in the colder months (approximately November– March) due to the customer protections that exist (discussed above). Disconnections peak in the months directly succeeding and preceding these winter months (April and October)
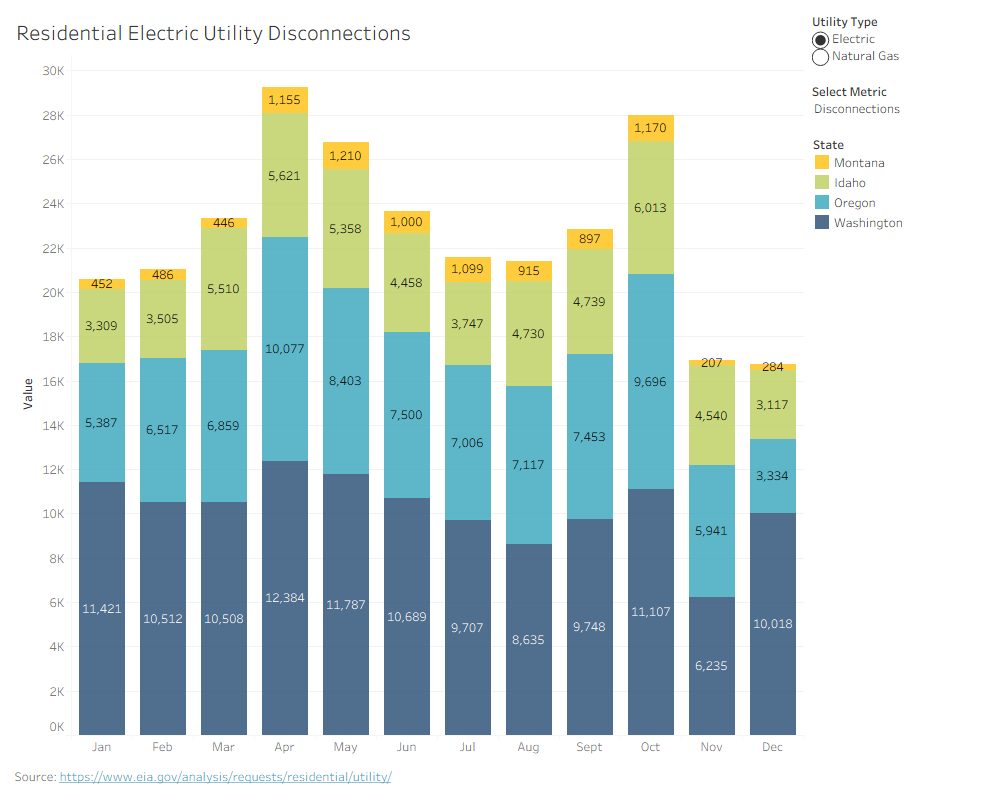
Figure 1. Residential Electric Utility Disconnections in the Northwest, 2024


The second tab (Figure 2) shows the residential utility disconnection rate. This rate is presented as the percent of residential customers disconnected in 2024 and is calculated as the annual sum of disconnections divided by the number of residential customers. Idaho has the highest electric utility disconnection rate in the Northwest, at 6.4%, while Montana has the lowest at 2.2%. The natural gas disconnection rates have a smaller range, from 0.6% (Washington) to 1.5% (Oregon).

All four Northwest states come in lower than the national average disconnection rate for electric utilities (9.4%) and natural gas utilities (2.2%).
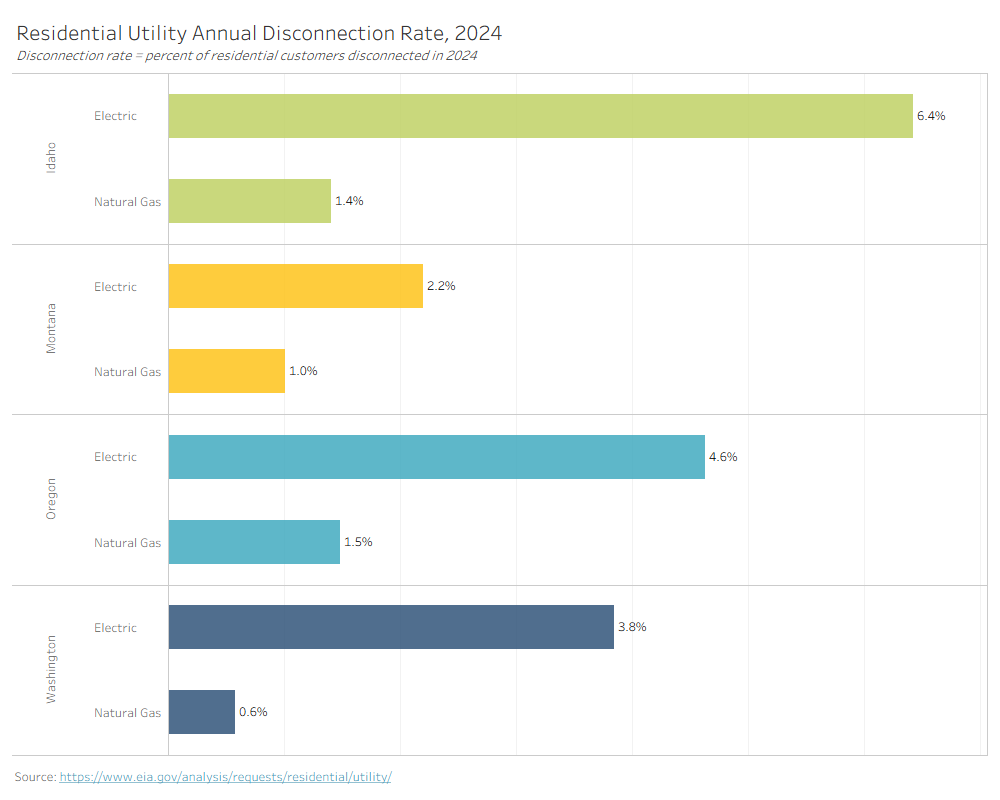
                                           Figure 2. Residential Utility Annual Disconnection Rate, 2024

‍

Lastly, the third tab (Figure 3) provides a table with summarized data, with the ability to filter the view to see these numbers by month and each individual utility using the dropdown menus at the top.

Following the data in one column from top to bottom helps paint the picture from total residential customers to number of final notices received to number of disconnections ultimately executed, presented as a percent (disconnection rate) as well. Then there are the number of reconnections, and finally the percent that were never reconnected in 2024.

The share of natural gas disconnections that were never reconnected is significantly larger than on the electricity side for all four Northwest states. This matches national trends (15% electric never reconnected vs. 29% natural gas never reconnected), but the EIA dataset and accompanying report do not indicate a reason for this difference. It is also worth noting that the dataset is only for 2024, so it is possible that service was reconnected in the following year for some of these customers. ‍
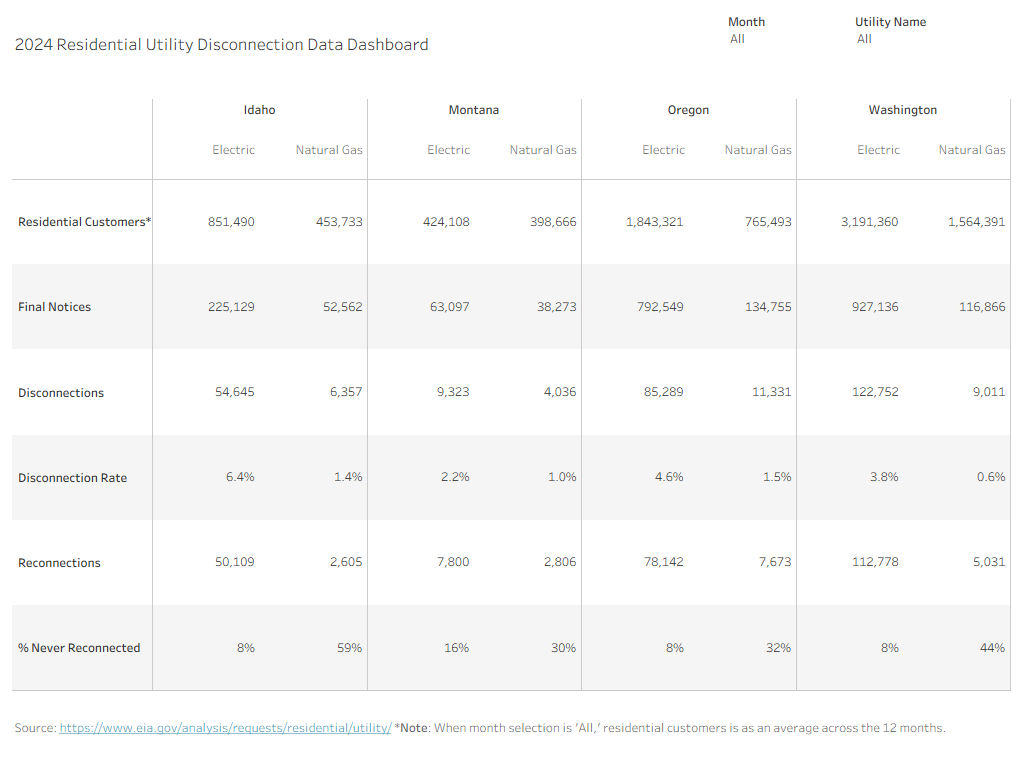
Figure 3. 2024 Residential Utility Disconnection Data Dashboard


By offering consistent, national, and comparable data across utilities, the EIA residential utility disconnections dataset fills a critical data gap and offers a foundation for understanding the scale and patterns of utility disconnections in the Northwest. We invite you to explore the data yourself on the Northwest Clean Energy Atlas.

If you want to receive updates from CETI straight to your inbox, subscribe here.

Open in new

Ruby Moore-Bloom

Research Analyst
Ruby Moore-Bloom is a Research Analyst at CETI who serves as technical project manager and/or provides research support for all CETI contract projects. She oversees the Northwest Clean Energy Atlas, which explores energy data relevant to deep decarbonization in the Northwest in interactive data visualizations. She has led all follow-up work related to the NZNW Workforce Analysis, including the Washington Department of Commerce Residential Energy Efficiency Workforce Needs Assessment; the Washington Department of Commerce Washington Refinery Study; and the Renewable Northwest and BWR Offshore Wind Jobs Study. Ruby also led CETI’s Clean Materials Manufacturing project, which provided research for industrial stakeholders and policymakers to understand different methods for decarbonizing six of Washington state’s manufacturing sectors.
FULL BIO & OTHER POSTS

Disconnected: Understanding Household Energy Shutoffs in the Northwest

Energy insecurity—the inability to adequately meet household energy needs—is a widespread issue across the United States. Certain households—including low-income, Black, Hispanic, and Native American households—are disproportionately affected and spend a larger portion of their income on energy bills. Households unable to pay their energy bill risk service disconnection and may be forced to make difficult decisions between paying utility bills and purchasing necessities such as food or medication. In fact, a September 2026 Consumer Reports survey found that one in five Americans report cutting back on groceries to afford electricity bills and approximately one quarter have adjusted their thermostat to uncomfortable levels to lower energy costs.

Data is critical to understanding the factors that contribute to energy insecurity and helping to identify potential solutions. Service disconnection, also known as a shutoff, that results from unpaid bills is one such important data element to understand, but it has historically been hard to obtain this data unless working for a utility. However, earlier this year, the U.S. Energy Information Administration (EIA) released results from the first comprehensive national survey of electricity and natural gas shutoffs, providing public access to a new national dataset.

This blog gives an overview of the EIA dataset, describes customer protections and bill assistance programs in the Northwest, and introduces the new Northwest Clean Energy Atlas visualization that CETI has published with the EIA data.

New EIA Report Provides Disconnection Data

In April 2026, the EIA released the Residential Utility Disconnections Report, the first comprehensive national survey of shutoffs.

The EIA collected data from electric and natural gas utilities on monthly final notices, disconnections, and reconnections due to bill nonpayment (arrearages) for calendar year 2024. For this report, the EIA defines these terms as follows:

  • Final notices: Last notice sent via mail, email, phone, and/or text to residential customers at least one day before account disconnections. Note that one customer account may receive a final notice multiple times in a year. The EIA reports total final notices per month per utility. Unfortunately, it does not specify how many individual accounts received final notices or how many final notices each account received.
  • Disconnections: The involuntary shut-off of electricity and/or natural gas service to residential customers due to bill nonpayment. Note that this category excludes voluntary disconnections (e.g., customers closing an account because they are selling the home, disconnecting from natural gas after electrifying all home appliances, etc.). One account can have multiple disconnections per year, and the EIA did not specify how many individual accounts experienced shutoffs. The EIA also did not collect information about how long each disconnection lasted.
  • Reconnections: Restoring electricity and/or natural gas service to residential customers who previously had service involuntarily disconnected due to bill nonpayment. Like final notices and disconnections, a customer can have multiple reconnections in one year.  

The EIA collected data through a mandatory survey to utilities that deliver electricity or natural gas to residential customers nationwide, representing 100% of natural gas residential customers and 98% of electricity residential customers (small electric utilities were not surveyed).

Nationally, there were approximately 1.7 million residential natural gas disconnections and 13.4 million residential electricity disconnections in 2024.

Customer Protections

Many states, municipalities, and individual utilities have policies in place to protect customers from disconnections in certain weather or in other situations to protect the health of customers. State-level customer protections generally apply only to regulated utilities (i.e., investor-owned utilities) in each state, though individual municipal utilities and electric cooperatives often have their own customer protection policies as well.

In the Northwest, the majority of homes are heated with electricity (51%) or natural gas (38%), and the four Northwest states have various protection policies for customers of regulated electricity and natural gas utilities. Table 1 summarizes state-level policies for regulated electricity utilities, as reported by Indiana University Energy Justice Lab’s Utility Disconnections Dashboard. Some of these policies apply to regulated natural gas utilities too; all four Northwest states have cold-based protections for natural gas customers.

Table 1: State-level Protection Policies for Customers of Regulated Electricity Utilities in the Northwest.

Source: Sanya Carley and David Konisky, 2023, "Utility Disconnections Dashboard," Energy Justice Lab. https://utilitydisconnections.org/dashboard/index.html

‍

For example, regulated electric utilities in Montana are not allowed to disconnect service for nonpayment from November 1 to April 1 if the customer is unable to pay, if the household has someone at least 62 years old, or if the household includes a handicapped individual (with documentation required for all). This cold-based protection holds true throughout the year for households meeting one of those criteria if the temperature at 8am is at or below freezing, or if there is a snowstorm or freezing temperatures forecasted within the next 24 hours. Oregon has an example of a medical protection: if a member of the household has a medical condition (medical certificate required) and the person’s health would be significantly endangered by a disconnection, regulated utilities must delay disconnection for the expected duration of the medical problem (but no more than six months, or 12 months for chronic illnesses; customers can renew the medical certificate).  

There are also different procedural requirements in terms of how the utility is required to provide final notices before disconnection. For more detailed information on the policies in each state, individual state factsheets are available on the Disconnections Dashboard.

However, it is not always enough to have these policies in place. The Energy Justice Lab points out in its 2023 paper, Electric Utility Disconnections: Legal Protections & Policy Recommendations, that many policies are vague, difficult to understand, or include requirements that customers are not aware of. The authors offer four broad recommendations for disconnection policies to be:

  • Easy to understand (e.g., easy-to-follow language, minimize ambiguity in interpretation)
  • Widely accessible (e.g., provide information on protections directly to customers at least twice a year)
  • Designed to reduce administrative burdens for households (e.g., adopt broad definitions of medical conditions, minimizing the burden on the customer to prove they do have a valid medical condition)  
  • Broadened to address impacts of climate change (e.g., use a combination of both date-based and temperature-based protections for better coverage due to more erratic weather patterns)

Some advocates go beyond calling for improvements to disconnection policies and argue that utility disconnections for bill nonpayment should never happen. For example, in Tsunami of Shutoffs, the Energy Equity Project argues that energy service is a human right that should not depend on a household’s ability to pay.

Bill Assistance

Programs exist at the federal, state, and utility level to provide assistance with bill payment. The federal grant program, Low-Income Home Energy Assistance Program (LIHEAP), provides grants to U.S. states and territories to administer for eligible recipients of certain poverty levels (either as a percentage of federal poverty guidelines or the state’s median income). Some states supplement federal LIHEAP funding with additional state energy assistance programs, but the availability of this assistance varies widely. Utilities also run affordability programs, including bill discounts, payment plans, payment assistance grants, and other forms of support.

Visualizing the Disconnection Data

To provide a Northwest-focused look at disconnections, we took the EIA data and created a new visualization for the Northwest Clean Energy Atlas.

The first tab shows residential utility disconnections, final notices, or reconnections, depending on the metric selected. For example, Figure 1 shows the number of electric utility disconnections in Northwest households. Disconnections are typically lower in the colder months (approximately November– March) due to the customer protections that exist (discussed above). Disconnections peak in the months directly succeeding and preceding these winter months (April and October)

Figure 1. Residential Electric Utility Disconnections in the Northwest, 2024


The second tab (Figure 2) shows the residential utility disconnection rate. This rate is presented as the percent of residential customers disconnected in 2024 and is calculated as the annual sum of disconnections divided by the number of residential customers. Idaho has the highest electric utility disconnection rate in the Northwest, at 6.4%, while Montana has the lowest at 2.2%. The natural gas disconnection rates have a smaller range, from 0.6% (Washington) to 1.5% (Oregon).

All four Northwest states come in lower than the national average disconnection rate for electric utilities (9.4%) and natural gas utilities (2.2%).

                                           Figure 2. Residential Utility Annual Disconnection Rate, 2024

‍

Lastly, the third tab (Figure 3) provides a table with summarized data, with the ability to filter the view to see these numbers by month and each individual utility using the dropdown menus at the top.

Following the data in one column from top to bottom helps paint the picture from total residential customers to number of final notices received to number of disconnections ultimately executed, presented as a percent (disconnection rate) as well. Then there are the number of reconnections, and finally the percent that were never reconnected in 2024.

The share of natural gas disconnections that were never reconnected is significantly larger than on the electricity side for all four Northwest states. This matches national trends (15% electric never reconnected vs. 29% natural gas never reconnected), but the EIA dataset and accompanying report do not indicate a reason for this difference. It is also worth noting that the dataset is only for 2024, so it is possible that service was reconnected in the following year for some of these customers. ‍

Figure 3. 2024 Residential Utility Disconnection Data Dashboard


By offering consistent, national, and comparable data across utilities, the EIA residential utility disconnections dataset fills a critical data gap and offers a foundation for understanding the scale and patterns of utility disconnections in the Northwest. We invite you to explore the data yourself on the Northwest Clean Energy Atlas.

If you want to receive updates from CETI straight to your inbox, subscribe here.

Ruby Moore-Bloom

Research Analyst
Ruby Moore-Bloom is a Research Analyst at CETI who serves as technical project manager and/or provides research support for all CETI contract projects. She oversees the Northwest Clean Energy Atlas, which explores energy data relevant to deep decarbonization in the Northwest in interactive data visualizations. She has led all follow-up work related to the NZNW Workforce Analysis, including the Washington Department of Commerce Residential Energy Efficiency Workforce Needs Assessment; the Washington Department of Commerce Washington Refinery Study; and the Renewable Northwest and BWR Offshore Wind Jobs Study. Ruby also led CETI’s Clean Materials Manufacturing project, which provided research for industrial stakeholders and policymakers to understand different methods for decarbonizing six of Washington state’s manufacturing sectors.
Full Bio & Other Posts

Get the latest updates from CETI directly to your inbox.

Related Posts

No items found.