
The resources used to generate electricity, often referred to as a fuel mix, vary greatly among utilities, states, and regions. In an updated set of visualizations on the Northwest Clean Energy Atlas, we show the fuel mix of utilities in Oregon and Washington and their greenhouse gas emissions and here we walk through key findings from each visualization.
The data used for these visualizations come from the Oregon Department of Environmental Quality and the Washington Department of Commerce. Both Northwest states require utilities to disclose the mix of fuels used to generate the electricity they sell to customers, and the two state departments categorize resources and quantify emissions in slightly different ways. For example, the Oregon data distinguishes Bonneville Power Administration (BPA) as a resource, while the Washington data allocates power from BPA directly to the resources, e.g., hydropower.
All visualizations use the most recent data available. For Washington, this is 2023 for fuel mix data and 2022 for electric utility emissions data. For Oregon, both fuel mix and electric utility emissions data are for 2023.
In addition to utility-specific data, this blog references economy-wide emissions. In Washington, the most recent Greenhouse Gas Emissions Inventory includes emissions through 2021. In Oregon, the most recent Greenhouse Gas Sector-Based Inventory includes preliminary data for 2023.
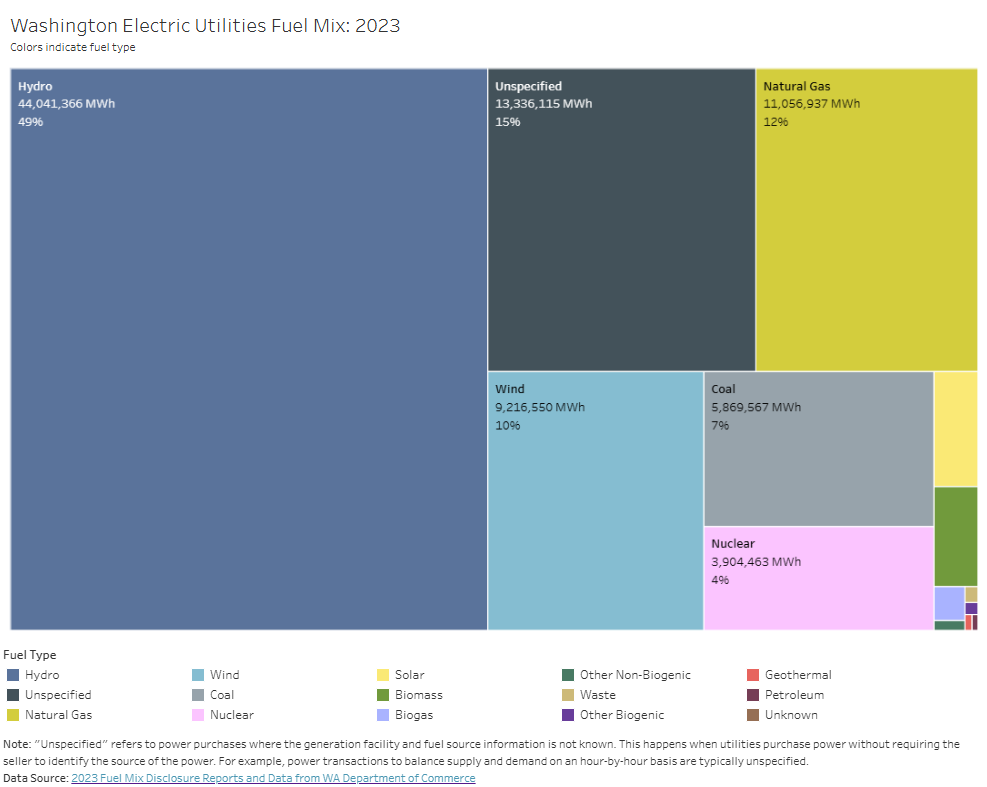
Washington relies heavily on hydropower, which supplied almost half (49%) of the state’s electricity in 2023. No other U.S. state consumed more hydropower than Washington in 2023. The next largest resource category was market purchases, which is power of an unspecified source purchased from another utility. These purchases accounted for 15% of the state’s fuel mix in this analysis. Notable non-hydro renewables include wind, which produced 10% of the state's electricity, and solar, which produced 1%. Looking at dominant fossil fuel sources, natural gas produced 12% of electricity and coal produced 7%. Nuclear produced 4% (Figure 1).
Utilities that sourced all or nearly all their power from BPA in 2023 will report the same fuel mix as each other: 78% hydropower, 11% nuclear, and 11% market. These tend to be smaller, public utilities such as Jefferson County PUD, the Okanogan County Electric Cooperative, and the Ellensburg Electric Division.
More variation in fuel mix exists between larger utilities. For example, Puget Sound Energy, which is the state’s largest electric utility, had a fuel mix of 30% natural gas, 30% hydro, 22% wind, and 18% coal; Snohomish Public Utility District sourced a full 10% of its power from nuclear; and hydropower accounted for only 8% of PacifiCorp’s fuel mix, while coal was 35%.
While the most recent utility emissions data reported to the Department of Commerce is for 2022, Washington’s most recent economy-wide Greenhouse Gas Emissions Inventory, published by the Department of Ecology, includes emissions through 2021 and shows that electricity consumption accounted for 20% of Washington’s total emissions. Emissions from electricity are trending down over time and further emissions reductions are expected from compliance with the Clean Energy Transformation Act (CETA).
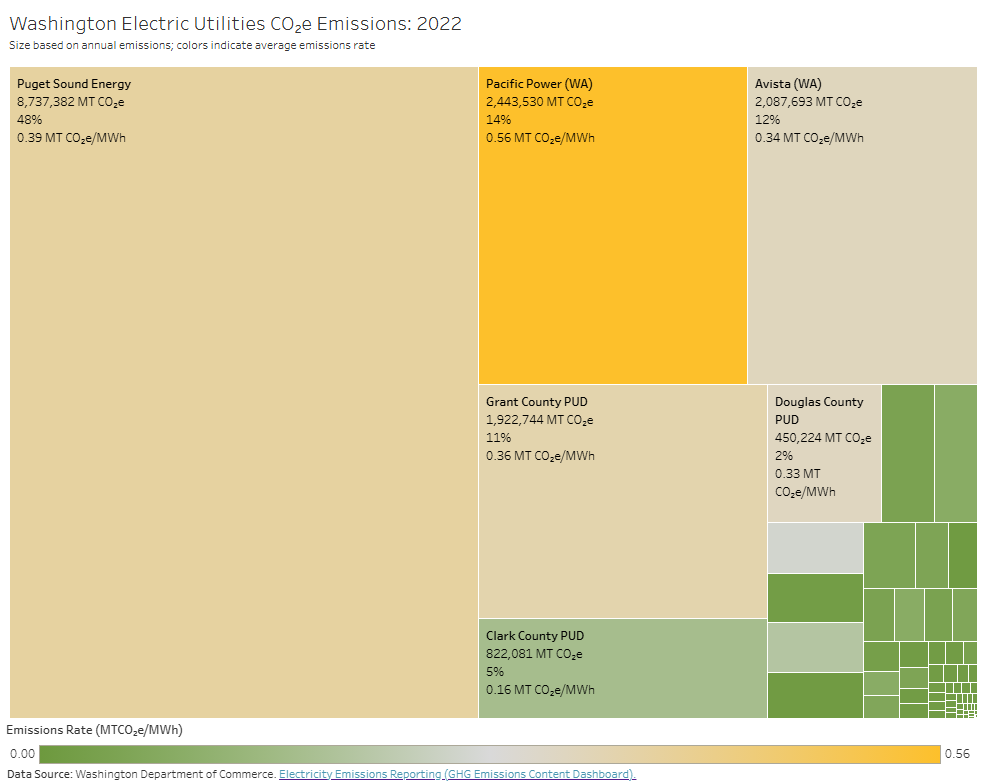
In producing this visualization for both states, we considered both the total emissions associated with electricity sold by the utility in metric tons of carbon dioxide equivalent (MT CO2e) and the emissions rate of electricity in MT CO2e per megawatt hour of generation (MT CO2e/MWh).
Puget Sound Energy produced more emissions than any other utility in Washington in 2022, with nearly nine million MT CO2e or 48% of total electricity emissions in the state. However, Pacific Power (the PacifiCorp subsidiary that services parts of southeastern Washington) had the highest emissions rate at .56 MT CO2e/MWh, which is roughly 40% higher than any other utility in the state (Figure 2).
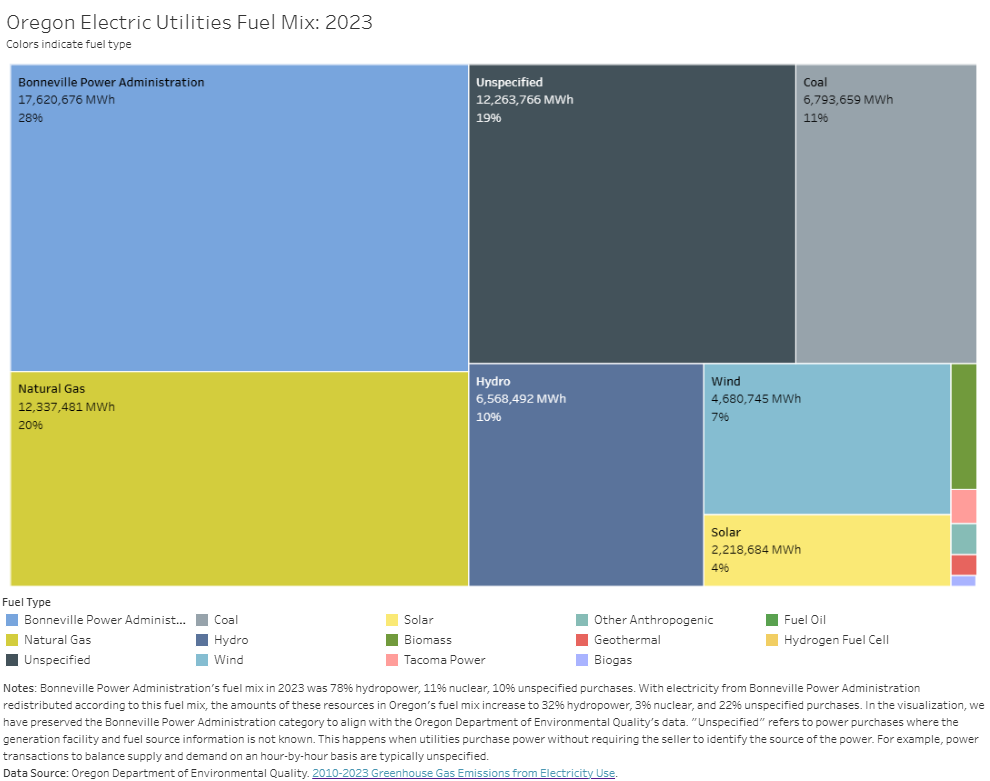
BPA comprised the largest share of Oregon’s overall fuel mix in 2023 at 28%. As noted above, BPA’s fuel mix was 78% hydropower, 11% nuclear, and 11% unspecified purchases. The state’s fuel mix also included 10% non-BPA hydropower and 19% non-BPA unspecified purchases. Other major sources of Oregon’s electricity were natural gas at 20% and coal at 11%. Wind and solar contributed 7% and 4%, respectively (Figure 3).
Smaller utilities that purchase all their power from BPA will show as 100% BPA. As with Washington, these are generally public utilities such as Hood River Electric Cooperative, Tillamook PUD, and the Umpqua Indian Utility Co-Op.
Portland General Electric, the state’s largest utility, relied on natural gas for 43% of its fuel mix. It also sourced 16% of its power from unspecified market purchases, 14% from hydro, and 10% from wind. PacifiCorp, the second largest utility in Oregon, had a fuel mix of 38% coal, 21% natural gas, 15% wind, 10% unspecified, and 8% solar.
Electricity consumption accounted for ~28% of emissions in Oregon in 2023, according to preliminary data from the Oregon Greenhouse Gas Sector-Based Inventory. Emissions from electricity are expected to decrease with implementation of HB 2021, which requires investor-owned utilities and electricity service suppliers to reduce emissions to 80% below baseline levels by 2030, 90% by 2035, and 100% by 2040.
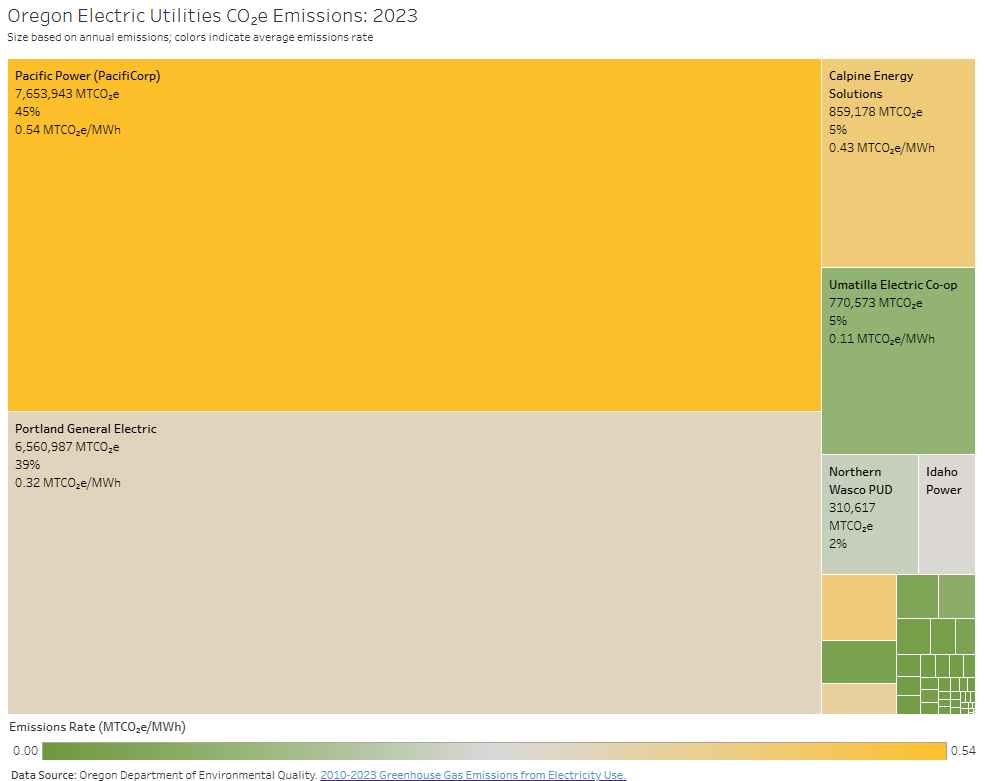
The two largest utilities in Oregon—Portland General Electric and PacificCorp—accounted for 84% of the state’s emissions from electricity consumption in 2023. Calpine Energy Solutions and Umatilla Electric Cooperative each contributed another 5% of electricity emissions.
Looking at emissions rate by supplier, PacifiCorp has the highest emissions per MWh of electricity, at .54 MTCO2e/MWh. This is approximately 25% more than Constellation New Energy, which has the second highest emissions rate at .43 MT CO2e/MWh. Emissions rates of other suppliers vary, with the low end at .01 or .02 MT CO2e/MWh for suppliers sourcing entirely from a mix of renewables, including solar, wind, and BPA resources.
We invite you to use these visualizations to explore the fuel mix and emissions contributions of electricity suppliers in Washington and Oregon. Their interactive features allow you to highlight a particular utility or look at all utilities.
While data are not collected at the utility level in Montana and Idaho, we hope to include these states in the future. If you have questions about using the data in the visualizations, ideas on how to expand these visualizations, or want to share how you have used this data, please let us know at info@cleanenergytransition.org. We would love to hear from you.
Sign up for CETI's mailing list to get updates straight to your inbox.


%20(1).jpeg)
.jpeg)